Positioning is not a hedge map
Most days the book is being flattened as it is taken. Positioning is a tail object. Open/close is a calm-market tape, and a chart that is right for the wrong reason will keep its believers.
Abstract
Most days the book is being flattened as it is taken. Positioning is a tail object. Open/close is a calm-market tape, and a chart that is right for the wrong reason will keep its believers.
The usual reading of a gamma chart is a hedge schedule. Market makers are short here, long there; if the underlying trades up to this strike they will have to sell, if it trades down to that one they will have to buy. The walls are support and resistance. The flip is the line where the obligation changes sign.
That sentence smuggles a forecast out of a position estimate. The greek is real. The obligation is not in the tape.
Gamma is the curvature of an option: how fast the delta changes as the underlying moves. A long-gamma book, delta-hedged, sells rallies and buys dips. A short-gamma book does the opposite: it buys strength and sells weakness to stay flat. Sheldon Natenberg is unambiguous about both the greek and the hedge mechanics in Option Volatility and Pricing. None of that requires a dealer chart. What the chart adds is a claim the public record does not contain: that this inventory is still sitting, still unhedged, still to be flattened in this underlying tomorrow.
That is the step a serious trader cannot take.
Two constructions
Two constructions get sold as that claim. They look different. They fail the same way.
The first multiplies each contract’s gamma by open interest, assigns a sign by option type (calls one way, puts the other) and calls the sum dealer gamma exposure. Open interest is unsigned. It does not say who is long. The call/put flip is a story about typical customer flow, applied to every strike. Gamma of a long option is positive whether the option is a call or a put; the aggregate sign is who holds it, not which type it is.
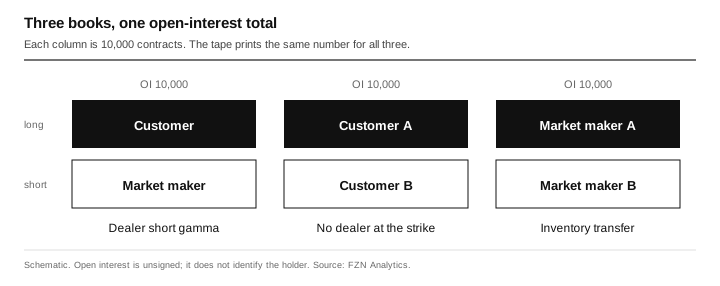
Figure 1. The same open interest is consistent with a dealer who is short gamma, with two customers trading with each other, and with two market makers transferring inventory. The tape prints one number.
The second construction is more sophisticated, which is why it is more dangerous. Take exchange open/close volume by origin (customer, firm, market maker, broker-dealer, professional; buy versus sell; open versus close), treat the market-maker residual as inventory, and carry that residual into the next session. Now you have a signed book, updated daily. The inference is: we know who took the other side, so we know how they will have to hedge.
You don’t. Those are two different objects. Origin data can tell you, with error, who opened listed options on that exchange. It cannot tell you what remains unhedged, or in what product the hedge will print.
What open/close actually is
Open/close is classified flow, usually arriving T+1. For each series: an origin code, a side, and whether the print opened a position or closed one. A position is something you reconstruct by adding that flow up over days. A hedge requirement is what is left unhedged on the whole desk, in whatever they use to flatten it.
It does not give a complete view of either.
Positions are not a balance sheet. You never see the book. You infer a running sum. A missed day, a bad start, exercise and assignment, or a contract that expired overnight permanently tilts the inventory you think they have. “Market maker” is a badge on a print, not a desk. Firm proprietary, professional customer, a wholesaler affiliate, and the named market maker can be the same economic book split across origin codes. Gârleanu, Pedersen, and Poteshman (2009), working from Cboe open/close, had to define dealers as exchange market-makers and everyone else as end-users. That definition is a choice, not a photograph.
The geography of the tape is a slice. Equity options trade on many exchanges. Cboe open/close is Cboe volume. A desk that buys on one venue and lays the gamma off on another still looks long in the first residual. SPX is the clean case, because it lists only there, which is why the honest work on this question is done in index options. Single names are not that case. FLEX, OTC, and a listed equivalent in another root never show up. A spread is two series: per-strike open/close can be exact on each contract and still not be the package that is being risk-managed.
Cboe’s own note on SPX 0DTE is the privileged version of this data. They see customer versus market maker, buy versus sell, open versus close on every SPX print. Volume, they point out, is not risk. If 100k contracts trade a strike and customers bought 50k and sold 50k, futures hedge demand from that line is zero. On 15 August 2023 a 4440 put did more than 100k contracts; market makers were left short about 3k, three percent of gross. Median net gamma around 3:30 p.m. was on the order of $173 million against hundreds of billions in S&P futures volume.
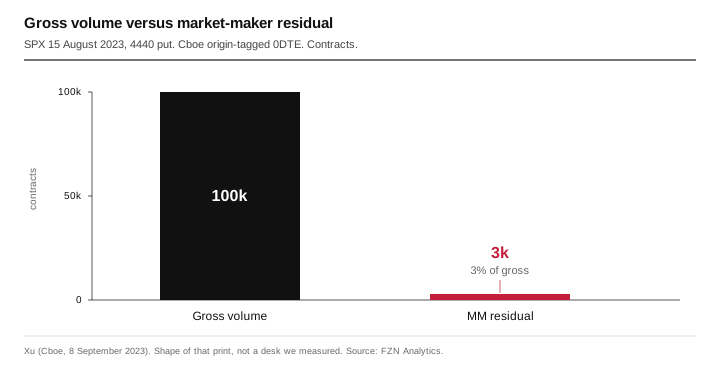
Figure 2. Gross volume is what the heatmap watches. The residual is what would have to be hedged, if it were still sitting, and if it were hedged in this underlying. Cboe’s 15 August 2023 4440-put print is the shape of that gap, not a claim we measured the desk.
That is why origin data is better than unsigned open interest. It is not a photograph of the book. Cboe, holding a better tape than anyone selling a running inventory from the public record, still will not treat the residual as the desk.
Hedging requirements are not even the same question. Suppose the options residual were perfect. You still would not know what they have to trade tomorrow, because hedge demand is not the option position.
They delta-hedge continuously in stock or futures. By the time T+1 open/close arrives, a lot of that delta is already gone. Delta-neutral at the close is not gamma-neutral. They flatten the delta with the linear product; the gamma can still be there in the morning, or it can be gone because they bought it back in the options market overnight. The tape you are looking at does not distinguish those states.
They flatten gamma with other options, not only with the underlying: other strikes, other expiries, a cheaper listed equivalent. Natenberg is explicit: when negative gamma at a single exercise price gets larger than they want, they prefer to buy options and to spread the exposure across strikes and expirations. The theoretical edge, if the volatility input is right, is earned by dynamic hedging through the life of the option, not by warehousing yesterday’s delta until tomorrow’s open.
Vanna and charm move the delta with implied volatility and with the passage of time, with no spot change. Open/close has nothing to say about that.
Gârleanu, Pedersen, and Poteshman built a demand-based pricing model on Cboe open/close. The load-bearing fact in that paper is that options cannot be perfectly hedged. Demand prices the unhedgeable leftover. If the tape were a complete hedge map, that paper would not exist.
So: open/close can tell you, with error, who opened listed options on that exchange. It cannot tell you how much of that gamma is still sitting, or in what they will flatten it. The 100% claim fails twice. People who carry the residual forward treat a noisy answer to the first question as a precise answer to the second.
A different product
The public tape is per contract. A market-maker book is a portfolio.
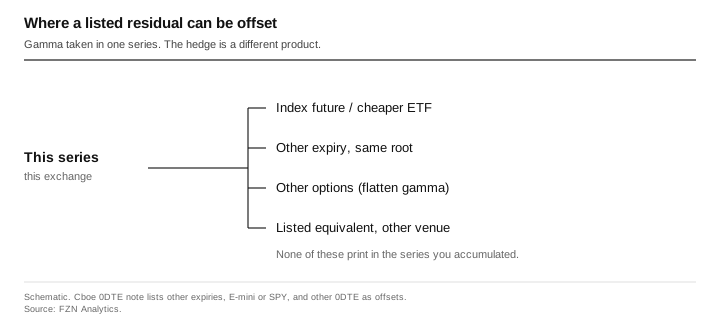
Figure 3. Index gamma taken in a weekly is routinely offset in the future, in a cheaper listed equivalent, in another expiry, or in other options. Those prints never hit the open/close series you are summing.
Index options are the clean case. Gamma taken in a listed index option is offset in the corresponding future, in a cheaper listed equivalent, in a weekly versus a standard, in a different expiry, sometimes in a related volatility product. Cboe says the same thing about their own 0DTE residual: market makers may have offsetting positions in other expiries, in E-mini or SPY, or they may hedge 0DTE with other 0DTE rather than with futures.
You can accumulate a perfect residual in one root and still have no idea whether the desk is long or short gamma as a book, because the hedge printed somewhere the origin tape does not join.
Single names are the same shape at smaller scale. A short call in the name can be offset with a call in a correlated name, with the stock, with a conversion, with a listed equivalent on another exchange. Open interest in the first contract does not shrink when the hedge is the second.
This is not a data-quality complaint. Better origin data, joined more carefully, still ends at the contract. The hedge-state lives on the desk.
Carrying the book forward
The running-sum version has a third assumption on top of the first two: that yesterday’s residual is still the position.
Each morning the accumulated book is treated as overnight obligation. Today’s flow is added. Tomorrow the new total is the new obligation. The construction only works if the desk did not lay the gamma off, did not roll it, did not offset it in another product, and did not already delta-hedge the move you are about to predict.
They hedge constantly. They hedge during the session. They hedge at the close. They hedge the overnight gap at the open. The interesting quantity for tomorrow’s flow is remaining unhedged gamma, not last night’s open contracts. Open/close does not report a hedge ratio. Open interest does not either.
Carrying the option position forward as a hedge map ignores the part of the job they actually do. Most days that job is the whole story.
Net gamma across a chain is the least trustworthy number on these charts for the same reason. It is a small difference of two large piles, each already signed by assumption. A modest error on one side, or a slice of inventory that was laid off in another product, moves the net, and can flip it, while the heatmap still looks the same. Location of mass survives that. The leftover sign does not.
The ordinary session, and the tail
The listed-options market, on a typical day, is a machine that is already hedging. Quotes are two-sided. Inventory is laid off in the future, in another expiry, in another option. Deltas are flattened through the session. What is taken in the morning is not sitting unhedged at the close, waiting for you to read it. Cboe’s own origin-tagged 0DTE residual is small for this reason: the flow is two-sided, and the leftover that would have to be hedged in the underlying is de minimis against the liquidity of the hedge. There is not much to derive from market-maker positioning on those days, even if you could see the book. The machine is doing what it is built to do.
The days that matter are the ones when the machine cannot.
A jump in the underlying is the clean case. Dynamic hedging assumes you can trade continuously along the path. The models these contracts are priced under assume that: no gaps, a continuous sample path. A left-tail gap does not offer a sequence of deltas to adjust. The warehouse of gamma that was being managed minute by minute is suddenly a position at a new spot, and the hedge, if it can be done at all, is done into the move, in whatever still has a bid. Jump risk cannot in general be laid off by trading the underlying alone. That is incompleteness, not a data problem.
The same shape appears without a crash: one-sided customer flow that does not mean-revert, a concentrated slug of negative gamma they cannot buy back, liquidity gone in the usual offset (the future, the cheaper listed equivalent, the other expiry). Natenberg’s point about not warehousing a large negative-gamma position at a single strike is a capacity limit. Most days they stay inside it. The tail is when they cannot.
That is when positioning would actually change what you do. It is also when the public reconstruction is worst. Open/close is T+1. It describes the machine as it was yesterday, in the product it was quoting, before the gap. The screenshot of last night’s residual is a calm-market object. Using it as a tail map is reading the oiled machine into the moment the oil is gone.
When the market does it anyway
The construction is often accurate enough that the next hour looks like the chart. Spot stalls near a large open-interest strike; the wall gets the credit. Sometimes the residual really was sitting, still unhedged, still in this underlying, and the hedge flow did some of the work. That happens. It is not rare enough to be dismissable, and not common enough to be a law.
It is also often not accurate enough, and the market does what you expected anyway. A dynamic tape has many reasons to stall at a round number with large open interest: the strike is where people already had orders; the session is quiet; a different book is long gamma; the move died for reasons that have nothing to do with this residual. When price does the thing, the chart is confirmed. When it does not, there is always a story: they laid it off, it was a different product, flow was balanced, wait for the next expiry.
Hits are visible. Misses are explained. A method that is allowed to be right for the wrong reason does not get abandoned. That is not only a side effect of a market that has more than one cause. It is how a convenience map becomes, in public, a holy object.
The test is not whether the level “worked.” The test is whether you could have known, before the print, that this residual was still unhedged in this product. Open interest cannot tell you. Open/close cannot tell you. A screenshot after the stall cannot tell you either.
This is how the ordinary session trains the tail mistake. Most days the machine hedges and the strike holds or it doesn’t for reasons that are not the residual. Those days are numerous, and they look like a method. The day you would have wanted the book (the gap, the one-sided flow, the strike they could not lay off) is the day last night’s origin tape is least about what is sitting now.
Pinning is not a hedge schedule
A large concentration at one exercise price is a real object. Natenberg is explicit that a large negative-gamma slug at a single strike is a particular concern. Ni, Pearson, and Poteshman (2005) documented that optionable stocks cluster at strikes on expiration more often than chance, and that the effect is stronger when market makers are net long options, weaker when they are net short. Pinning, when it is the long-gamma mechanism, is bids underneath the strike and offers above it: buy dips, sell rallies, stability. Short gamma at the same strike is the opposite: buy strength, sell weakness, amplification.
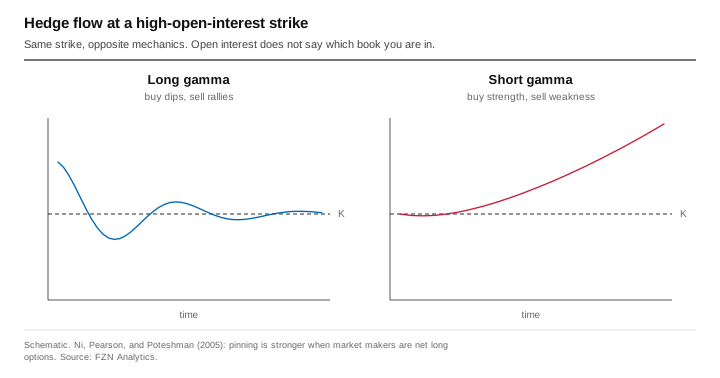
Figure 4. The same high-open-interest strike is a magnet if the long-gamma side is hedging, and an accelerant if the short-gamma side is. Open interest does not say which world you are in. Ni, Pearson, and Poteshman needed signed market-maker positions to tell them apart.
Those are opposite hedge flows. Calling both of them a wall that dealers must defend collapses the distinction the research actually turned on. Location of mass is usable. The obligation is the assumption speaking.
What we still draw
We still plot gamma by strike. Knowing where the mass is is useful. That concern is about concentration. It does not require pretending we know the sign of the Street’s residual, or the product they will use to flatten it.
The chart is a convenience. The sign on it is an assumption, and we will label it as one. It is not dealer inventory. It is not a hedge schedule. It is not support or resistance.
Today’s flow we will show as today’s flow: who initiated, in this session, in this contract. That is a print. It is not a book carried forward, and we will not add it to yesterday and call the sum an obligation.
What a serious trader can use
Use the map for location. A lot of gamma sitting at a strike is a fact about the chain. Whether dealers are long or short that gamma is the assumption speaking. Whether they must buy or sell the underlying if spot goes there is a second assumption on top of the first.
Use origin-tagged flow, if you have it, as flow. Someone opened. Someone closed. That is worth knowing. It is not a multi-day mandate for a desk you cannot see, and it is not a hedge ratio.
Do not trade the leftover net on an ordinary day. The machine is already hedging; there is not much in the residual to derive. Watch concentration, and watch for the session that is no longer ordinary: a gap, a one-sided book they cannot lay off, a hedge product that has stopped taking size. That is when positioning would matter, and that is when a T+1 running sum is least about the desk in front of you.
Do not treat a wall as a level the market maker is obliged to defend. Do not take a stall at the strike as proof the residual was the cause. The dangerous step is not computing the greek. It is reading a hedge schedule out of a position you do not observe, in a product they do not have to use, from a residual they do not have to still be holding, and then keeping the method because the calm tape confirmed it often enough.
We’d rather be precise than certain.
Sources
Natenberg, Sheldon. Option Volatility and Pricing. Gamma as curvature; delta-hedging; market makers as last resort; buying options to reduce concentrated negative gamma; dynamic hedging as the source of theoretical edge.
Gârleanu, Nicolae, Lasse Heje Pedersen, and Allen M. Poteshman. “Demand-Based Option Pricing.” Review of Financial Studies 22, no. 10 (2009). Dealers and end-users identified from Cboe open/close. Options cannot be perfectly hedged; demand prices the unhedgeable part.
Ni, Sophie Xiaoyan, Neil D. Pearson, and Allen M. Poteshman. “Stock Price Clustering on Option Expiration Dates.” Journal of Financial Economics 78, no. 1 (2005). Pinning is empirical; the sign of the market-maker book is what separates a magnet from an accelerant.
Xu, Mandy. “Much Ado About 0DTEs — Evaluating the Market Impact of SPX 0DTE Options.” Cboe, 8 September 2023. Origin-tagged SPX flow: volume is not risk; gross versus residual; the ordinary residual is small because the flow is two-sided and the leftover is not identified with a futures hedge, nor with a single expiry or a single listed equivalent.
On jumps and incompleteness: Natenberg on the false assumption of continuous trading with no gaps; Rebonato on jump risk that cannot be hedged by trading the underlying alone. The left tail is the failure of the hedge the ordinary session assumes.